WILL THIS BE ENOUGH?
to finally get some momentum and political pressure going in the industrialised nations to reign in fossil-fuel emissions, and prevent runaway warming and catastrophic sea level rises? http://www.commondreams.org/headline/2011/07/01-6
We here at the Alaska Progressive Review have for some time have been giving you our assessment of the current state of the global climate, and it's rapid process of change, due to the release of CO2 and Methane, from fossil fuel combustion. Mainly from the industrialised nations, the two biggest sources being now China, and the U.S.
We here at the Alaska Progressive Review have for some time have been giving you our assessment of the current state of the global climate, and it's rapid process of change, due to the release of CO2 and Methane, from fossil fuel combustion. Mainly from the industrialised nations, the two biggest sources being now China, and the U.S.
Of course all of our assessments have been based on the current state of the science of climatology, meteorology, and atmospheric physics. Now, more "official" governmental scientists are speaking out, and this IS IMPORTANT! Unfortunately, you aren't seeing much of this in the U.S. corporate media, note that the following article comes from the U.K.-based Independent, a somewhat progressive newspaper.
Extreme Weather Link 'Can No Longer Be Ignored'
Scientists to end 20-year reluctance with study into global warming and exceptional weather events
by Steve Connor
Scientists are to end their 20-year reluctance to link climate change with extreme weather – the heavy storms, floods and droughts which often fill news bulletins – as part of a radical departure from a previous equivocal position that many now see as increasingly untenable.
 In this April 19, 2011 file photo, smoke rises from an uncontrolled wildfire burning near Possum Kingdom, Texas. It was a spring to remember, with America pummeled by tornadoes, floods, wildfire, snowmelt, thunderstorms and drought. (AP Photo/LM Otero, File)
 Climate researchers from Britain, the United States and other parts of the world have formed a new international alliance that aims to investigate exceptional weather events to see whether they can be attributable to global warming caused by greenhouse gas emissions.
They believe that it is no longer plausible merely to claim that extreme weather is “consistent” with climate change. Instead, they intend to assess each unusual event in terms of the probability that it has been exacerbated or even caused by the global temperature increase seen over the past century.
The move is likely to be highly controversial because the science of “climate attribution” is still in the early stages of development and so is likely to be pounced on by climate “skeptics” who question any link between industrial emissions of carbon dioxide and rises in global average temperatures.
In the past scientists have been extremely reluctant to link a single extreme weather event with climate change, arguing that the natural variability of the weather makes it virtually impossible to establish any definitive association other than a possible general consistency with what is expected from studies based on computer models.
However, a growing number of climate scientists are now prepared to adopt a far more aggressive posture, arguing that the climate has already changed enough for it to be affecting the probability of an extreme weather event, whether it is an intense hurricane, a major flood or a devastating drought.
“We’ve certainly moved beyond the point of saying that we can’t say anything about attributing extreme weather events to climate change,” said Peter Stott, a leading climate scientist at the Met Office Hadley Centre in Exeter.
“It’s very clear we’re in a changed climate now which means there’s more moisture in the atmosphere and the potential for stronger storms and heavier rainfall is clearly there.”
Kevin Trenberth, a distinguished senior scientist at the US National Center for Atmospheric Research (NCAR) in Boulder, Colorado, also believes the time has come to emphasize the link between extreme weather and the global climate in which it develops.
“The environment in which all storms form has changed owing to human activities, in particular it is warmer and more moist than it was 30 or 40 years ago,” Dr Trenberth said.
“We have this extra water vapor lurking around waiting for storms to develop and then there is more moisture as well as heat that is available for these storms [to form]. The models suggest it is going to get drier in the subtropics, wetter in the monsoon trough and wetter at higher latitudes. This is the pattern we're already seeing.”
The Met Office and NCAR have joined forces with other climate organizations, including the influential US National Oceanic and Atmospheric Organization (NOAA), to carry out detailed investigations of extreme weather events, such as the vast flooding in Pakistan last year, to see whether they can detect a climate change “signal” as a likely cause.
A group of their researchers has formed a coalition called the Attribution of Climate-Related Events which is preparing a report on the subject to be published later this year at a meeting of the World Climate Research Program in Denver. They hope in the future to assess each extreme weather phenomenon in terms of its probability of being linked with global warming and then to post the result on the internet.
“There is strong evidence if you look across the world that we are seeing an increase in heatwaves and floods and droughts and extreme rainfall and extreme temperatures,” Dr Stott said.
“The evidence is clear from looking at the observational records globally that extreme temperatures and extreme rainfall are changing. But you can’t jump from that and say that a specific event is straightforwardly attributable because we know that natural variability could have played a part.
“We’ve been developing the science to be increasingly more quantitative about the links and make more definitive statements about how the risk has changed. You look sensibly about these things by talking about changing risk, or changing probability of these events.”
Dr Stott had his colleagues have already carried out studies of the 2003 heatwave in Europe, in which up to 35,000 people died of heat-related illnesses, as well as the devastating UK floods in 2000 which cost £1.3bn in insurance claims and destroyed 10,000 homes following the wettest autumn in England and Wales since records began in 1766.
In both cases, the scientists found that the contribution of man-made greenhouse gases to global warming substantially increased the risk of such extreme events occurring. The group is also investigating the exceptional warm April in Britain this year, which was the warmest since central England records were kept in 1659 and 0.5C warmer on average than the previous warmest April.
Also this year, an unprecedented number of tornadoes across the southeastern US and the flooding of major rivers such as the Mississippi and Missouri led many people to question whether they were exacerbated by global warming. In the past scientists would have been reluctant to link single weather events such as these with climate change, but Dr Trenberth believes this is wrong.
“I will not say that you cannot link one event to these things. I will say instead that the environment in which all of these storms are developing has changed,” Dr Trenberth told The Independent.
“It’s not so much the instantaneous result of the greenhouse effect, it’s the memory of the system and the main memory is in the oceans and the oceans have warmed up substantially, at depth, and we can measure that. I will assert that every event has been changed by climate change and the main time we perceive it is when we find ourselves outside the realms of the previous natural variability, and because natural variability is so large this is why we don't notice it most of the time.
“When we have things that occur usually 4 per cent of the time start to occur 10 per cent of the time, that’s when we begin to notice. The main way we perceive climate change is in changes in the extremes, this is when we break records.”

A report by the insurance company Munich Re found that 2010 was one of the worst years on record for natural disasters, nine-tenths of which were related to extreme weather, such as the floods in Pakistan and eastern Australia and heatwave in Russia, which is estimated to have killed at least 56,000 people, making it the most deadly natural disaster in the country’s history.

“This long-term trend can no longer be explained by natural climate oscillations alone. No, the probability is that climate change is contributing to some of the warming of the world’s oceans,” said Peter Höppe, author of the Munich Re report.
Making the connection
Tornadoes, US, 2011 More than 220 people were killed by tornadoes and violent storms that ripped through south-eastern United States in April; 131 were killed in Alabama alone. Fifteen people died in Tuscaloosa and sections of the city were destroyed.
Heatwave, UK, 2011April was the warmest since 1659, when records in England began. Sun-lovers flocked to St Ives, above, but fears of drought were raised. Rainfall in the UK that month was only 52 per cent of the long-term average.
Drought, Brazil, 2005 The Amazon region suffered the worst drought in more than a century. The floodplains dried up and people were walking or using bicycles on areas where canoes and river boats had been the only means of transport.
Floods, USA, 2005 Katrina was one of the five deadliest hurricanes in the history of the US, and it caused the destruction of New Orleans when levees were overwhelmed. Some 90 per cent of residents of south-east Louisiana were evacuated.
©independent.co.uk
To this list, we here at the Alaska Progressive Review, would add the incredible heat wave and devastating wildfires, which occurred in southeast Australia, in February, 2009.
http://akprogressive.blogspot.com/2011/04/alaska-fire-seasons.html
http://akprogressive.blogspot.com/2011/04/alaska-fire-seasons.html
As well as our increasing annual wildfire acreages in Alaska, and throughout western North America. Our future, on this Earth, imperiled by overpopulation, resource depletion, and pollution, doesn't have to turn out this way:
But it will, or worse, if the current, sociopathic, predatory capitalistic system that now controls most of the World's countries and policies, is left unchecked and unchanged. A system that only accepts the importance of corporate profit, no matter the human or environmental costs. A system, like cancer, that relies and is predicated on unlimited growth and expansion, which eventually kills it's host.
Since it is the 4th of July today, when we saw this comment, written in response to an article on the Truth-Out site about corporate political dominance in the US, we felt it worthy of sharing. As we feel it is spot-on.
http://www.truth-out.org/new-war-independence-against-corporate-politics/1309788086
"There have been a lot of articles like this recently. This is an encouraging trend but I feel they all miss one important point; this is not just an American problem to be solved in the USA. It is now a global problem.
The issue is no longer gaining independence from domination by another nation. The era of the nation state being a safe haven for its citizens against other nation states is almost over and can't be brought back. Nations have become corrals for the lower classes policed by governments that are in the pockets of global corporations.
All of these huge corporations favor maintaining their headquarters or at least a significant presence in the USA so they can have access to our military and other resources through their indentured politicians to help pursue their global goals. They also promote alliances between governments they control and the formation of multinational military forces biddable to no one government so they can more easily control and coordinate on a multinational basis - a form of hedging well known to the bankers amongst them.
In this scenario encouraging voters to replace elected representatives in this or that country makes as little sense as swapping out dictators and tyrants by force of arms elsewhere.
Those in power around the Western world have been fairly successful in convincing their citizens that they face a global threat even if that threat is loosely defined. What's needed for change is to acknowledge that this is true but that the threat comes from within, not from outside. This was the kernel of our own Declaration of Independence.
With that gem of truth and an inkling that we need to move towards a new system of global governance in mind we might start to see some of that long-lost independence gleaming faintly at the end of the tunnel."
Since it is the 4th of July today, when we saw this comment, written in response to an article on the Truth-Out site about corporate political dominance in the US, we felt it worthy of sharing. As we feel it is spot-on.
http://www.truth-out.org/new-war-independence-against-corporate-politics/1309788086
"There have been a lot of articles like this recently. This is an encouraging trend but I feel they all miss one important point; this is not just an American problem to be solved in the USA. It is now a global problem.
The issue is no longer gaining independence from domination by another nation. The era of the nation state being a safe haven for its citizens against other nation states is almost over and can't be brought back. Nations have become corrals for the lower classes policed by governments that are in the pockets of global corporations.
All of these huge corporations favor maintaining their headquarters or at least a significant presence in the USA so they can have access to our military and other resources through their indentured politicians to help pursue their global goals. They also promote alliances between governments they control and the formation of multinational military forces biddable to no one government so they can more easily control and coordinate on a multinational basis - a form of hedging well known to the bankers amongst them.
In this scenario encouraging voters to replace elected representatives in this or that country makes as little sense as swapping out dictators and tyrants by force of arms elsewhere.
Those in power around the Western world have been fairly successful in convincing their citizens that they face a global threat even if that threat is loosely defined. What's needed for change is to acknowledge that this is true but that the threat comes from within, not from outside. This was the kernel of our own Declaration of Independence.
With that gem of truth and an inkling that we need to move towards a new system of global governance in mind we might start to see some of that long-lost independence gleaming faintly at the end of the tunnel."
BACKYARD RAMBLING
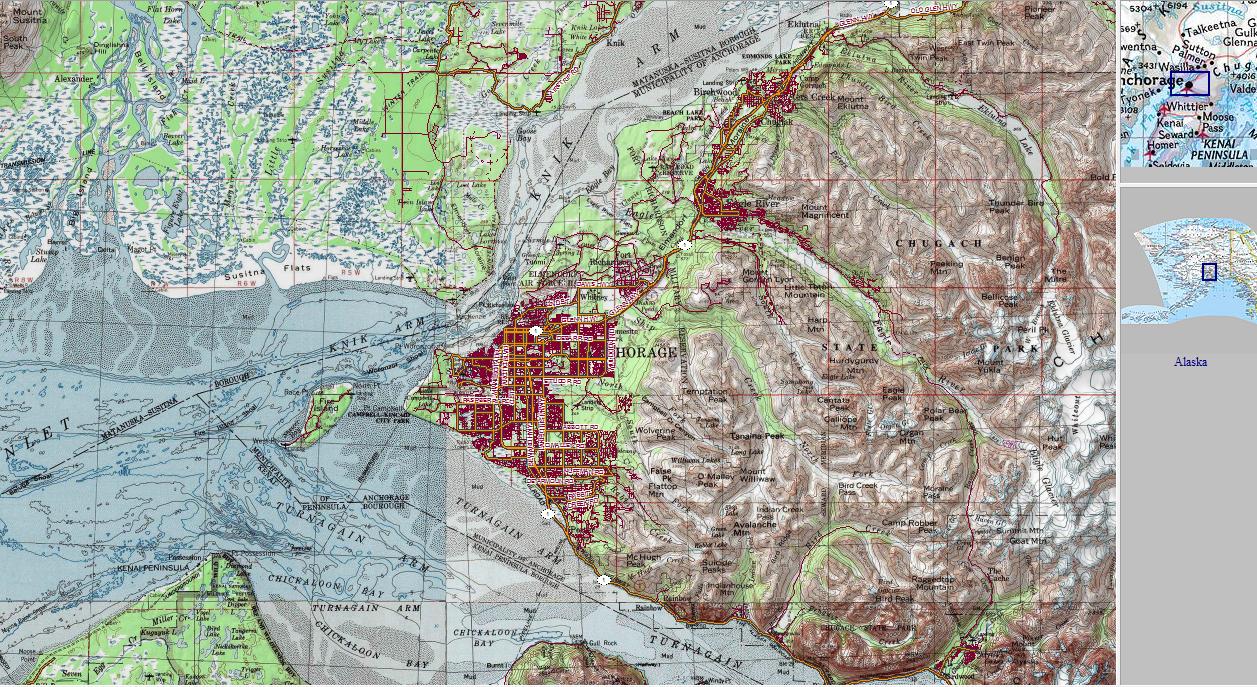
The Chugach Mountains literally form the backyard of the Anchorage "Bowl", and really are our backyard, here at the Chugach Front Research Centre; we are in them nearly every day running, skiing, and taking solace in their natural beauty and wonders.
 The other day, we set out for a 30 KM "slow-pack" in our backyard, to some areas we've been in a few times this past winter. Namely, we wanted to finally ascend "The Ramp", which at 1598 metres (5240 ft.), had eluded us twice, for different reasons. Although it was a cool, cloudy day, the promise of rain the next day, meant we had to give it our all, when we could at least stay dry, even if we did have to ascend into the clouds at times. We're calling it "slow-pack", versus our usual fast-packs, because we did have to ascend the Ramp in the fog, very slowly, so as not to lose our way, and fall into trouble.
About an hour after starting out, we were already on our way up toward Ship Lake Pass, which at 1250 metres (4100 ft), offers beautiful views down a steep slope, toward the north through east. Before that though, our intrepid, and completely fearless assistant editor is already on the job. Running full speed ahead constantly in search of new, and sometimes disgusting treasures, and assessing any potential threats to our well-being. She truly is an amazing little being. As you can see, the clouds are already scraping the higher peaks.
 At the top of Ship Lake Pass, which took about three hours to hike into, we were already just about in the clouds. But the view to the east, of beautiful alpine Ship Lake, was not to be missed. It's not too difficult of a descent, down into the lake, and Ship Creek Valley, but we had more ascending to do.
  The view to the north, of the Ship Creek Valley, was also well worth the trip, even on a cool, cloudy day. Here at the top of the pass, it was about 5C (41F), with a steady 30 kph (18-20 mph) breeze. I definitely had to put a hat and gloves on, when we stopped here for a breather and some water. But the Ramp beckoned, even through the top 300 metres were totally obscured in the fog. We slowly ascended up its steep slopes, clad in tundra, mixed in with large areas of loose scree/talus, which sometimes easily gave way with just a slight pressure of the feet. Requiring us to be very careful. We knew the way though, from our previous attempts, and also that the valley/bowl we came up, was right below us, and still beneath the clouds. When we reached the ridgeline of the Ramp's sharp sharktooth-like peak, we actually felt a little queasy and disoriented in the thick fog, with visibilities of 10 metres or less. Because as we looked down into the abyss on the north side of the ridgeline, with it's sheer 300+ metre drop, we couldn't see the bottom. Homer is almost 15 now, and he had no problem ascending with us on these steep slopes, for which we were very greatful. But we give him lots of exercise, in outings like this, good food, and attention, which keeps him thriving.
  We just spent a few minutes in the fog at the top of the Ramp, hoping for some clearing. Once in awhile, a thin spot in the clouds would let more light in, but the visibility never did improve to more than 20 metres or so. It was a cool 2-3C up there (35-38F), with a stiff south breeze, rather chilly. So we slowly descended back down the gentler, but still steep, south face, back to the valley we came up in. We had lunch where the the trail that takes off from the Powerline trail, splits in two, one branch heading to the Ship Lake Pass, the other to Hidden Lake. We hadn't been to Hidden Lake before, so we needed to check it out. It was just 3 or 4 more KM up, and another 300 metres or so of elevation. There was one small lake first, about 2 KM in, but after a steep rise, on the other side, in a bowl, part of whose headwall is the Ramp, lies the jewel of Hidden Lake, a very apt name, as it can't be seen, until you are right on it.
  We are quite sure that on a rare sunny day, this lake would have that beautiful pale blue alpine colour we greatly prize in our outings, as it means these lakes are completely clean, wild, and unspoiled by any human activity (and also very cold!). It was starting to sprinkle a bit after we got here, so we didn't spend much time. Had it been a warmer, sunny day, there is no doubt I would have gone for a swim in there, I'd sure like to some day. We descended back down to the trail junction, and then down to the Powerline Trail. We still wanted to head in to an area we haven't seen before, so just before we reached the trailhead, we decided to head up the Middle Fork Loop trail, which has a steep ascent up a ridge on the other side of the valley that the Powerline trail is in. It was raining lightly at this point, but we didn't care, as we just had another hour or two, before finishing. As we ascended this steep section of trail, we ran into a group of 15 teenagers with two adult chaperones, on a five-day pack-trip. These kids were from all over the World, the adults are part of a group that takes teens on trips like this to build leadership and outdoor skills. All the kids just loved Mattie and Homer, since most had never seen real sled dogs, and were very nice. I told them to expect alot of rain on their trip, but I'm sure they had a good time.
  Our ascent brought us up to 1050 metre (3500 ft) Little False Point, which has a beautiful view of the Anchorage "Bowl" and Cook Inlet, in the evening sun. It was getting later in the evening and I didn't bring full dinners for Homer and Mattie, so we headed quickly back down after that, and to the trailhead, so I could rush them home in the short 15 minute drive back to the CFRC, for dinner. After all, in our 30 KM 8 1/2 hour backyard ramble, Mattie must have done at least double that, with all her running around, and Homer, probably 40-50 KM. This is why we live here, to be so fortunate to have this for our backyard.


 Further up the canyon, it opens up into tall grass fields, as you gain elevation above 1500 feet. The weather up here gets progressively colder and harsher by this altitude, than down in the city below 500 feet. The real high country really teases us as we keep going up. These peaks are only around 5000 feet, but they are completely devoid of life, nothing grows on them, not even lichens or moss, it is so cold and harsh, at that altitude.