
What we are attempting to do in this article, is to quickly project what we think the climate of Anchorage will be fourty years hence, in the year 2051. Using the most up-to-date peer-reviewed scientific research. And your lead editor's 24 years of operational weather forecasting experience throughout the Western Lower 48 and Alaska. And no, we are not expecting Anchorage to burn up, necessarily, though fire seasons will certainly be a little longer, and more intense, than they are currently. But the Anchorage area, because of it's proximity to the cool waters of the Gulf of Alaska and Cook Inlet, will never have as extreme fire danger, or behaviour, as that seen further north, in the warmer (in summer), drier, interior. Your lead editor has some expertise in this area, having worked with and studied from some researchers at the University of Alaska, Fairbanks, and earlier, at the University of Montana, in Missoula. All involved on the cutting edge of climate change/global warming research.

Before projecting ahead though, we need to look at the current climate of the Anchorage area.
Anchorage is blessed with the most favourable climate for human habitation in the entire state! Perhaps that is why it is the largest population centre here. Why is that?
Well, let's look at some statistics, from the three main centres, in which we have all lived, since 1998. First, Juneau, which is a good representation for all of coastal Alaska, around the Gulf, from Kodiak to Ketchikan.
JUNEAU 2, ALASKA (504094) Period of Record Monthly Climate Summary
Period of Record : 7/ 6/1965 to 12/22/2010
| Jan | Feb | Mar | Apr | May | Jun | Jul | Aug | Sep | Oct | Nov | Dec | Annual | |
| Average Max. Temperature (F) | 33.3 | 37.0 | 40.9 | 48.7 | 56.1 | 62.2 | 63.7 | 63.2 | 56.7 | 48.7 | 39.9 | 36.0 | 48.9 |
| Average Min. Temperature (F) | 24.5 | 27.3 | 30.3 | 34.9 | 41.5 | 47.9 | 51.0 | 49.9 | 45.3 | 38.9 | 30.8 | 27.2 | 37.5 |
| Average Total Precipitation (in.) | 6.96 | 6.12 | 5.98 | 5.01 | 5.67 | 4.23 | 5.75 | 7.57 | 11.93 | 12.87 | 9.45 | 8.54 | 90.08 |
| Average Total SnowFall (in.) | 24.2 | 12.0 | 7.7 | 0.8 | 0.0 | 0.0 | 0.0 | 0.0 | 0.0 | 0.3 | 8.0 | 15.8 | 68.8 |
| Average Snow Depth (in.) | 5 | 4 | 2 | 0 | 0 | 0 | 0 | 0 | 0 | 0 | 1 | 2 | 1 |
These numbers are from downtown Juneau, which is wetter, and milder, than the airport, or Mendenhall Valley, where the other large residential areas are. But 90 inches of precipitation (229 cm) is alot, and there is no real dry season, though April-July are "drier". Note how mild the winter temperatures are, and how short of duration the average snow depths are.

Because it is so close to the mild Gulf of Alaska, with usually some sort of flow off of it, it rarely stays well below freezing for periods of more than a week or two in winter, separated by rainy, milder, onshore flow periods. Which we found to our great dislike, as it meant good snow for nordic skiing would be ruined after a week or two. And running in driving rain at temperatures of 35-45F (1.5-8C) for much of the year, we found not to prefer. This sort of climate, can be found right around the corner, from Anchorage, up Turnagain Arm, in places like Girdwood, or Portage. Slightly colder and snowier in winter than Juneau, but still having rainy periods in winter disrupting good snow conditions, and much rainier in the warm season. So let's look at Anchorage's numbers:
This is the closest climate station to the Chugach Front Research Centre, about 5 KM to its west. So our winter temperatures are slightly colder than this, but summer's, about the same. And our precipitation is probably slightly higher, maybe by two to three inches (5 to 8 cm).
ALASKA PACIFIC UNIVERSITY, ALASKA (500172) Period of Record Monthly Climate Summary
Period of Record : 7/ 1/1993 to 10/31/2004
| Jan | Feb | Mar | Apr | May | Jun | Jul | Aug | Sep | Oct | Nov | Dec | Annual | |
| Average Max. Temperature (F) | 21.0 | 28.5 | 34.4 | 46.3 | 56.9 | 64.9 | 67.5 | 65.5 | 56.6 | 41.3 | 28.9 | 23.5 | 44.6 |
| Average Min. Temperature (F) | 8.8 | 14.1 | 15.8 | 28.2 | 38.4 | 47.3 | 51.9 | 49.3 | 40.6 | 27.0 | 17.1 | 12.6 | 29.3 |
| Average Total Precipitation (in.) | 0.66 | 0.85 | 0.98 | 0.33 | 0.63 | 1.11 | 1.61 | 3.00 | 3.03 | 2.23 | 1.25 | 1.55 | 17.23 |
| Average Total SnowFall (in.) | 9.4 | 12.0 | 12.8 | 1.6 | 1.1 | 0.0 | 0.0 | 0.0 | 0.0 | 7.2 | 12.0 | 20.2 | 76.3 |
| Average Snow Depth (in.) | 13 | 14 | 17 | 6 | 0 | 0 | 0 | 0 | 0 | 2 | 6 | 11 | 6 |

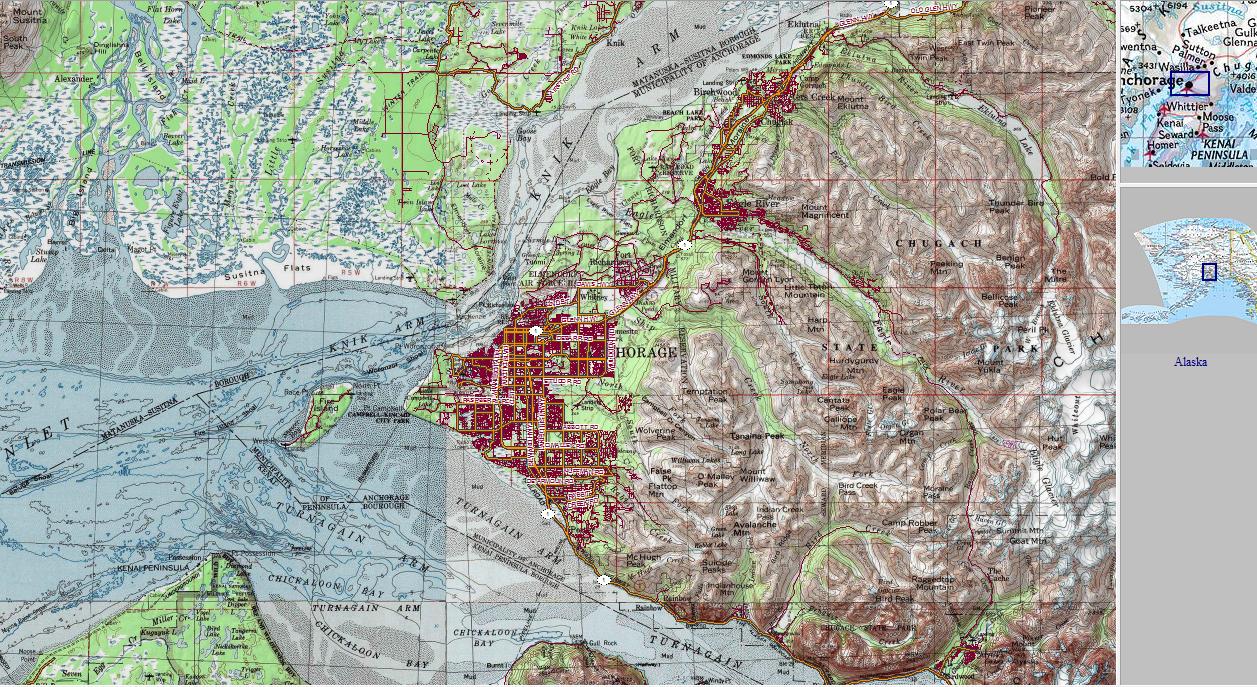
Look at that annual precipitation, 17.23 inches (44 cm)! Versus the 90 inches (229 cm) in downtown Juneau! Note the colder winter temperatures, and deeper/longer average snow depths. This gives us one of the most favourable climates for nordic skiing, of any city on Earth! It's the Chugach Mountains, and the mountains on the Kenai Peninsula, which cup the Anchorage "bowl" from the northeast to the south, that work their magic for us. By protecting us from precipitation in east to south flows, which occur very frequently, as low pressure systems hang in the Gulf of Alaska for weeks on end, fed by the moisture and relative warmth (in the cool season) of the Pacific Ocean. Annual precipitation at the Alyeska Resort, near Girdwood, just 50 KM (31 miles) southeast, up Turnagain Arm, is 73 inches (185 cm). Note our increasing monthly precipitation values from May through September. In the weak summer jet stream, lows in the Gulf of Alaska become more frequent, and contain more moisture, as the summer wears into fall, and enough of their influence is felt here, but not nearly that seen just around the corner, or in Southeast Alaska, thank you Chugach Mountains!
The Chugach mountains also protect the Anchorage bowl from strong winds associated with other weather patterns as well. Just to the north, in the Matanuska and Susitna valleys, places like Palmer, Wasilla, and Talkeetna, have similar winter temperatures, but can receive very strong winds, especially from the Northeast and East, in the Matanuska valley, which are highly unpleasant in winter, and even scour all the snow away. Talkeetna, north in the Susitna valley, is wetter in summer, and hence boggier, with worse mosquito and fly densities.
What about further north, in Fairbanks? Well, these numbers tell the story very succinctly:
FAIRBANKS WSO AIRPORT, ALASKA (502968)
Period of Record Monthly Climate Summary
Period of Record : 9/ 1/1949 to 12/31/2010
| Jan | Feb | Mar | Apr | May | Jun | Jul | Aug | Sep | Oct | Nov | Dec | Annual | |
| Average Max. Temperature (F) | -1.2 | 8.4 | 23.7 | 42.6 | 60.1 | 70.8 | 72.3 | 66.3 | 54.7 | 32.2 | 11.6 | 1.5 | 36.9 |
| Average Min. Temperature (F) | -18.8 | -14.0 | -3.2 | 20.3 | 37.9 | 49.3 | 52.0 | 46.8 | 35.6 | 17.3 | -4.8 | -15.3 | 16.9 |
| Average Total Precipitation (in.) | 0.58 | 0.42 | 0.35 | 0.29 | 0.58 | 1.34 | 1.97 | 1.85 | 1.07 | 0.77 | 0.67 | 0.68 | 10.56 |
| Average Total SnowFall (in.) | 10.5 | 8.3 | 6.0 | 3.1 | 0.7 | 0.0 | 0.0 | 0.0 | 1.3 | 10.4 | 12.7 | 12.2 | 65.1 |
| Average Snow Depth (in.) | 17 | 21 | 20 | 10 | 0 | 0 | 0 | 0 | 0 | 2 | 8 | 13 | 7 |
Max. Temp.: 99.8% Min. Temp.: 99.8% Precipitation: 99.9% Snowfall: 99.9% Snow Depth: 99.8%
Those are quite cold temperatures, which represent the interior as a whole, from mid November through February. Sometimes much colder, and sometime warmer. Making outdoor recreation more cumbersome and less enjoyable, especially when combined with the shorter day and low light. It is drier in general, with sometimes very comfortable and enjoyable summers. But also much more prone to summer wildfires in the drier ones, which can lead to heavy smoke accumulations for long stretches, in very active seasons. Which are becoming more frequent.
So now that we have established that Anchorage's climate is the most benificent in the state, what kind of changes are likely in it, by 2051? We think it helps to first see how things have been changing over the past decades. http://climate.gi.alaska.edu/papers/Arctic62-3-295.pdf

We thought this table to be especially significant, showing the seasonal breakdown of temperature changes in each area of the state. And that in the sixty years from 1949 to 2009, the average increase across the state has been +3F (+1.7C), more than the Earth, as a whole, but predicted by global climate modeling, the "Arctic Amplification". Driven by changes in duration of snow and sea ice cover, which change the "albedo" of the land/water. With shorter durations now of sea ice and snow cover, more solar heat is absorbed, for longer periods of the year.
Seeing how the seasonal breakdown of temperature increase has gone down for Anchorage, and surrounding areas, what does the latest climate change modeling suggest, for the next several decades?
This link, to the Arctic Climate Impact Assessment, research conducted and described by the most prominent atmospheric and climatic scientists in the World, projects, based on an average of the different global CO2 emissions scenarios, a global temperature increase of 2C by about 2050. Given that Alaska has already experienced twice the global increase over the past 60 years, we think it prudent then to expect a 4C average temperature increase across this area by 2051. But it won't be evenly spread across every month. We expect the 4C increase to generally follow the seasonal breakdown, that has already occurred over the past sixty years. Let's revisit that. The summer and fall increases are only half that of spring, and a quarter, of that of winter.
This makes sense, given the fact that we have noticed, over the past few decades, more "highly amplified" jet stream patterns of "meridional" flow, that is, flow more from south to north, than west to east, over Alaska and along the northwest section of North America, from about 40N, in winter and spring, when the jet stream is the strongest. Just a quick reminder, the jet stream is how heat is re-distributed to the poles, from the tropics. Because the poles lose more heat than they gain in solar energy, and the tropics gain more than they lose.
We're seeing more highly amplified patterns where large high pressure ridges extend much further north than they normally have been, in winter and spring. Moving tremendous masses of warm air aloft to very high latitudes, which eventually mixes down to the surface, over higher terrain, and along the north slopes of the Alaska Range, where very strong, dry chinook winds occur more frequently now, and which often produce high fire danger. So a continuance of this pattern is to be expected, and an amplification.
So let's re-work the Alaska Pacific University climate data, which is a proxy for what we see here at the Chugach Front Research Centre. Though our winter temperatures are somewhat colder, especially at night, due to our location in a slight depression, right at the front of the Chugach Range.
ALASKA PACIFIC UNIVERSITY, ALASKA (500172)
Period of Record Monthly Climate Summary
Period of Record : 7/ 1/1993 to 10/31/2051
| Jan | Feb | Mar | Apr | May | Jun | Jul | Aug | Sep | Oct | Nov | Dec | Annual | |
| Average Max. Temperature (F) | 30.0 | 36.7 | 42.3 | 52.4 | 58.6 | 70.0 | 69.0 | 68.5 | 61.0 | 47.4 | 34.5 | 30.4 | 50.0 |
| Average Min. Temperature (F) | 14.5 | 21.0 | 24.2 | 33.5 | 41.5 | 50.5 | 52.9 | 52.6 | 45.0 | 34.2 | 24.4 | 18.3 | 34.3 |
| Average Total Precipitation (in.) | 0.90 | 0.85 | 0.98 | 0.33 | 0.63 | 1.11 | 1.90 | 3.50 | 4.10 | 2.68 | 1.80 | 1.80 | 20.58 |
| Average Total SnowFall (in.) | 18.9 | 15.0 | 10.3 | 0.5 | 0.0 | 0.0 | 0.0 | 0.0 | 0.0 | 2.4 | 15.0 | 29.3 | 91.4 |
| Average Snow Depth (in.) | 18 | 16 | 12 | 1 | 0 | 0 | 0 | 0 | 0 | 0 | 6 | 13 | 6 |
Max. Temp.: 89.4% Min. Temp.: 89.4% Precipitation: 89.5% Snowfall: 89.1% Snow Depth: 87.7%
Check Station Metadata or Metadata graphics for more detail about data completeness.
The reason the summer increases are the lowest is due to Anchorage's geography.
As the interior, north of the Alaska Range, and in the Susitna Valley, just to the north of the Anchorage bowl, heats up more, overall in the summer, this pulls a south to southeast flow up through and around the region. Cool, maritime air, chilled by the waters of the Gulf of Alaska, Cook Inlet, and Turnagain Arm. Waters, which even in 2051, would only likely warm 1-2C by then, to around 10C in summer (50F). Still quite cool and able to keep average summer temperatures down. In fall, winter, and spring, more highly amplified high pressure ridging episodes would bring greater amounts of sub-tropical warmth for longer durations. Thus fall and winter snowfall would diminish, but in the depths of winter, increase. Snow cover would then take longer to establish in fall, and be earlier to melt, in Spring. By two to three weeks on each end. Winter extreme cold spells, where night-time temperatures can drop to -29 to -32C (-20 to -25F), would be more infrequent, and of shorter duration.
Let's look at a few specific hazards or problems that Anchorage faces, and how that would change.
Let's look at a few specific hazards or problems that Anchorage faces, and how that would change.
Wind storms:
Most people have a general idea that the Gulf of Alaska and Bering Seas produce treacherous weather, in the form of deep low pressure systems, and strong fronts, especially from September through April. These don't strike Anchorage full-force, usually, because of our sheltered location, as mentioned before. But once in awhile, one can hold together with enough strength, in just the right pattern, to produce winds of 80-100 mph, or even stronger, along the hill-slopes of the Chugach Front. With continued increases in highly amplified jet stream flow, the conditions for lows to deepen rapidly and become very strong, will increase. Thus, we would expect greater frequencies of these downsloping wind events in Anchorage, overall, and strong winds from frontal passages to increase. Another hazard is strong cold, northerly winds from the interior, to a low in the Gulf of Alaska. Our subjective feeling is that these probably will weaken in intensity, somewhat. Driven by the fact that winter, bitter cold Arctic airmasses over the Interior won't be as deep and of long duration as they are currently.
Snow Storms and Freezing Rain:
Due to Anchorage's unique geography, cold air in winter continually, except only under the strongest of south flows, drains south through the Susitna Valley, from the Interior, after filtering through the gaps in the Alaska Range. This, combined to the proximity of the relatively warm waters of partially ice-covered Cook Inlet, occasionally allows heavy snowfall events to occur, when small lows form right over the Inlet, and move over the Bowl. In which 20-40 cm (8-16 inches) can fall in 24-48 hours. We expect these fairly infrequent events to remain so, since the colder air draining from the interior, will be warmer, as well.
Freezing rain events are another story entirely, however. We expect these to significantly increase over the coming decades to become a real problem, not just in Anchorage, but in most of mainland Alaska. Because in winter we are getting our strongest "meridional" flow patterns (strong southerly flow ahead of an upper-level ridge), which move very mild air north from the subtropics. This is how more heat is delivered to these higher latitudes, and thus, if the climate overall is going to continue warming, the pattern that is most responsible for this, will increase. A perfect example of this was the record-breaking ice storm of this past 21-23 November. Which paralysed Fairbanks with 20 mm (.80") of freezing rain, and Anchorage with about 14 mm. Coating all the roads with ice, causing numerous accidents and downed power lines. And unfortunately for Fairbanks, once that ice accumulated on the roads, it stayed there all winter! This freezing rain event, at one point, for three hours, was depositing ice accumulations from Seward, north, all the way to Barrow! Unprecedented in Alaska history.
http://akprogressive.blogspot.com/2010/11/dont-need-weatherman-and-matties-fourth.html

Wildfire:

The Anchorage Bowl specifically, doesn't experience nearly as many days of higher fire danger, than the interior, north of the Alaska Range, in spring or summer, due to the proximity of the waters of Cook Inlet, and Gulf of Alaska. Any kind of light to average flow from the southeast through southwest is moistened from these, and relative humidities during the day, are usually too high to dry the boreal forest out.
But occasionally, warm/dry spells in May to July can temporarily disrupt this pattern. When high pressure ridging builds directly over the region, and suppresses the local sea-breezes, and drier air from the north through east is forced in. We would expect an increase in this pattern, with stronger high pressure ridging, overall, but only a moderate increase. The other hazardous pattern that can produce higher fire danger, is when strong winds blow along the Chugach Front hill slopes, if the temperatures are high enough, and relative humidities, low enough. This occurs in the warm season, but infrequently. We would expect a moderate increase in these in the shoulder seasons, spring and fall, and slight increases in June and July. Due to the stronger low pressure sytems that would occur in Spring or Fall, having warmer airmasses than currently, and hence, lower relative humdities, in down-sloping winds. The Anchorage hillsides have very thick, tangled boreal forest vegetation, with extensive stands of dead and dying bug-killed white and black spruce trees, which could prove flashy and hazardous, in a very strong, and dry, downsloping wind event.
But occasionally, warm/dry spells in May to July can temporarily disrupt this pattern. When high pressure ridging builds directly over the region, and suppresses the local sea-breezes, and drier air from the north through east is forced in. We would expect an increase in this pattern, with stronger high pressure ridging, overall, but only a moderate increase. The other hazardous pattern that can produce higher fire danger, is when strong winds blow along the Chugach Front hill slopes, if the temperatures are high enough, and relative humidities, low enough. This occurs in the warm season, but infrequently. We would expect a moderate increase in these in the shoulder seasons, spring and fall, and slight increases in June and July. Due to the stronger low pressure sytems that would occur in Spring or Fall, having warmer airmasses than currently, and hence, lower relative humdities, in down-sloping winds. The Anchorage hillsides have very thick, tangled boreal forest vegetation, with extensive stands of dead and dying bug-killed white and black spruce trees, which could prove flashy and hazardous, in a very strong, and dry, downsloping wind event.
Thunderstorms:
The Anchorage Bowl usually only sees one or two weak thunderstorms, with just limited lightning, some small hail, and brief heavy rain, each late spring/summer. Some years none occur. This is because of the cool, stable air usually present at lower levels, chilled by the waters of the Gulf of Alaska and Cook Inlet, stabilises the lower atmosphere. Nonetheless, thunderstorm activity across Alaska as a whole has been increasing over the past 25 years, especially over the interior and Alaska Range. This is because, with the summer warming, and a resultant deeper troposphere (the lowest layer of the atmosphere in which all sensible weather occurs, usually 5-10 miles, or 8-16 KM deep, lower in winter), the lowest levels of the atmosphere become more unstable, and then, showers have the ability to become deeper, reaching higher heights, and hence stronger. Capable of generating lightning, as up and downdrafts in the deeper clouds are stronger. People on the Kenai Peninsula, and climbing rangers at Denali base camp, in the Alaska Range, have reported to your lead editor that they are now seeing thunderstorms each summer, when even 10-15 years ago, none ever occurred. I found this out the hard way when I did a 27 mile fast-pack on the Kesugi Ridge trail, in the Alaska Range, and was hit by lightning, when storms with continuous cloud-to-ground strikes overtook me. http://akprogressive.blogspot.com/2009/05/kesugi-ridge-experience.html. What we expect for Anchorage specifically then, are more episodes of stronger thunderstorms forming over the Chugach mountains, then drifting off and weakening over the Bowl, as they encounter cooler, stable lower-level maritime air. This happens in other coastal areas south down the North American continent.
This has been a quick, summary, of what we expect to see by 2051, here in Anchorage. This seems quite likely, as there is no coordinated, global effort to limit CO2 emissions, and unless the general socio-political systems in the "developed countries" change, there won't be for many decades. And the warming by 2090 will easily be doubled, from that in 2051. Cheers.
No comments:
Post a Comment